One day I decided I wanted to be able to "see" what was going on inside the RAM in my linux desktop computer. And now through the magic of LLM AIs and some time, debugging, and tweaks, I can. I haven't ported it to gtk3 yet so it's gtk2 only for now.
memgaze.pl (94KB, requires libperl-gtk2 and 'aplay' binary for sound)
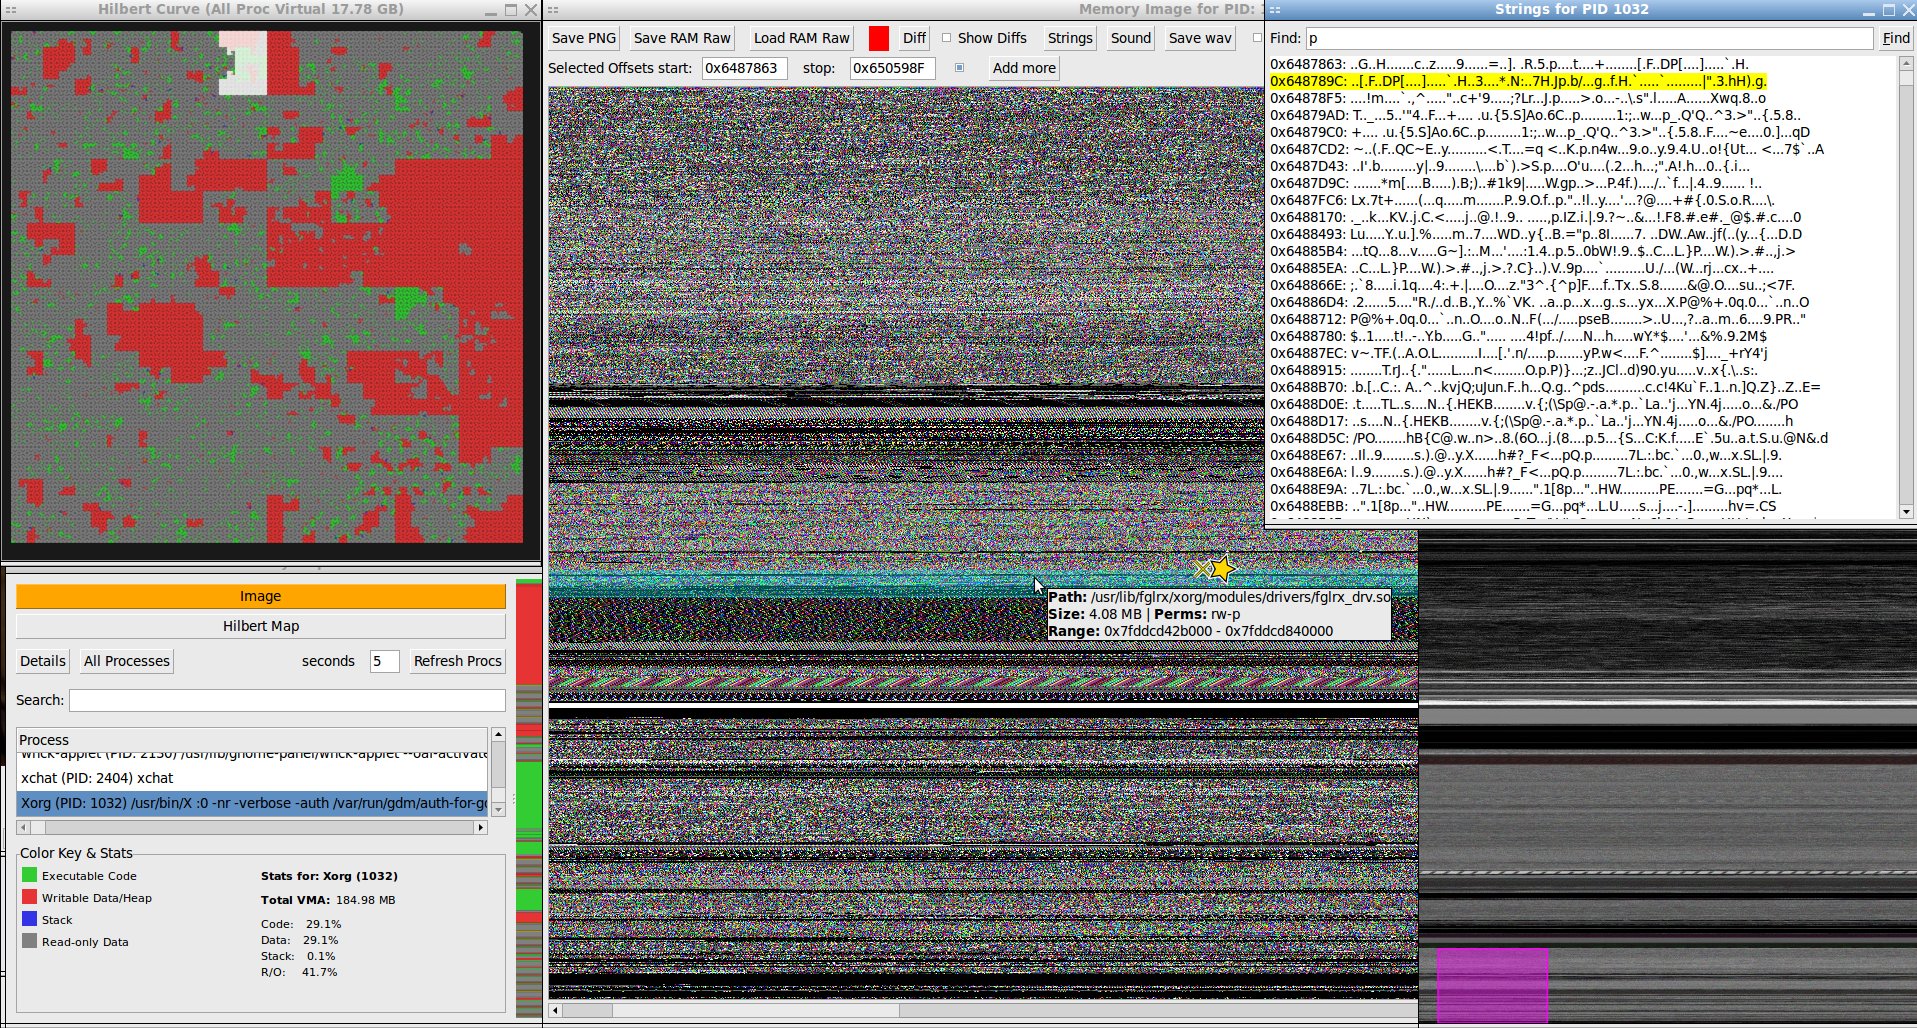
memgaze is a linux process virtual RAM exploration tool. It creates visualizations as images of the *virtual* RAM of any accessible process (run with sudo) and can save them as PNG. It also can play any RAM dump or subsection(s) of it as a sound file or save to wav. It has tool-tip overlays that show what type of RAM allocation it is and what, if any file it's associated with on disk (or heap or stack or anonymous) on both the hilbert map and image map.
To make the image memgaze walks through massive strings of ram dump bytes, taking them three at a time to form each pixel. Each byte has a value from 0 to 255. Coincidentally each color channel in a standard 24-bit RGB pixel is also represented by a value from 0 (no intensity) to 255 (full intensity). This allows for a 1-to-1 mapping.
The 1st byte becomes the Red component of the first pixel.
The 2nd byte becomes the Green component of the first pixel.
The 3rd byte becomes the Blue component of the first pixel.
The 4th byte becomes the Red component of the second pixel.
The 5th byte becomes the Green component of the second pixel.
And so on...
You might think this would lead to inconsistent coloring just because something shifts by one byte but it's not. The same libraries always look the same way when loaded in ram and visualized this way. Even between reboots and across different computers. And with time I'm starting to see how different types of RAM allocations have different types of textures. The data really does speak for itself.
For generating sound it's different.
But first a diversion: I've found some really interesting sounds in various programs. I really like libgtk-3.so it has some nice bass. Here's some musical tracks that I selected as truly "computer generated" music. Listen to this while you read how it works.
The stream of bytes from memory is a sequence of points that define a sound wave. Each byte's value is interpreted as the amplitude (loudness or position) of the sound wave at a single, tiny moment in time.
Unlike the image which groups bytes into threes, the sound translation treats every single byte individually. For sound the RAM dump is interpreted as unsigned 8 bit values and each byte is treated as an unsigned integer from 0 to 255. This number represents the position of the speaker cone at one instant. A value of 128 is considered the "center" or silent position. A value of 255 tells the speaker to push all the way out. A value of 0 tells the speaker to pull all the way in.
A sequence of bytes like 128, 150, 200, 255, 200, 150, 128, 100, 50, 0, 50, 100, 128... would create a simple smooth oscillation (a pure tone).
For example a snippet of memory containing the ASCII string "Hello..." followed by some binary data.
Hex Value 	Decimal Value 	Interpretation as Sound Amplitude
0x48 	72 	Speaker cone is pulled in from center.
0x65 	101 	Speaker cone is still pulled in, but closer to center.
0x6C 	108 	Getting even closer to center.
0x6C 	108 	No change from the last sample.
0x6F 	111 	Still pulled in.
0x00 	0 	Speaker cone pulls all the way in (max negative).
0xFF 	255 	Speaker cone pushes all the way out (max positive).
0x7F 	127 	Almost perfectly centered (nearly silent)
When played back at 8,000 bytes per second (8 KHz sample rate), this sequence creates a series of rapid clicks and pops. The relatively smooth values of the "Hello" string would sound like a low, static-like rumble. The sudden jump from 0x00 (0) to 0xFF (255) would produce a very sharp "click" or "pop" because it's telling the speaker to move from its most retracted position to its most extended position in just 1/8000th of a second.
To get a birds eye view of the virtual ram system it maps all used virtual ram onto a space filling hilbert curve with selectable sub-section and tool-tips showing the proportional use of virtual RAM by every process. Right click any highlighted process on the map to 'Image' it's RAM in a new window. To be clear, this is virtual RAM mappings, and the numbers it gives are not useful when you're trying to figure out the physical amount of RAM any given process is using (though it is proportional).
On the image map there's a small "thumbnail" view for zipping around truly gigantic ram dump images for convenience on slower machines. The image of the RAM can animate it live at the user supplied rate (default every 1s) but this only really works with small amounts of RAM because refreshing big GB amounts takes time. When the RAM is 'Updating' the state it was when the 'Update' button was pressed is stored to compare against the final state when updating is done with the 'Diff' tool which turns green when there's an old version to diff against. The 'Strings' tool runs $ strings against the full RAM image or whatever set of offset selections are checkbox marked active and then marks them on the RAM image with a star and recenters the view on this location and displays all matches with their file offset in the text box. Deleting the search string and hitting enter on the empty box restores the raw strings output list.