Someone recently pointed out to me that much of what memgaze is has already been done, and better. True, and if I could've remembered the ghidra's name I think I would've tried to use it with the digraph plugin. But ghidra is very complex and heavy to set up. What it, and it's sources, are good for is good ideas! It's full of them. Particularly a form of binary visualization and identification using "digraphs" from Voyage of a Reverser_A Visual Study of Binary Species_ Sergey Bratus_ Greg Conti_ BlackHat USA_ 2010.pdf. To quote them,
A digraph is when bytes in the binary data are considered in sequential pairs. So that for the binary data of the ascii text "black hat" it would be,

bl	(98,108)
la	(108,97)
ac	(97,99)
ck	(99,107)
k_	(107,32)
_h	(32,104)
ha	(104,97)
at	(97,116)

Or the ascii string "battelle" would be,
ba		(0x62, 0x61)
 at		(0x61, 0x74)
  tt		(0x74, 0x74)
   te 		(0x74, 0x65)
    el		(0x65, 0x6c)
     ll		(0x6c, 0x6c)
      le	(0x6c, 0x65)
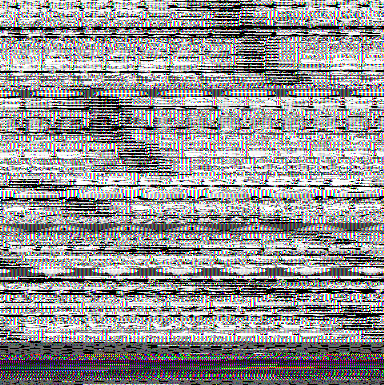
I basically just vibe coded this into memgaze 'image' mode and the result was instantly useful. The pairs of numbers (from the sequential byte pairs) are considered coordinates of pixels in an image object 256*256 in size and plotted as green pixels on a black background. But I noticed that detail was missing when I used *lots* of data so I added a 'normalized' mode too. I think it's pretty cool and both normal and normalized mode show different aspects.
Mouse hover over the example digraph images below for the process name and which part of memory is represented. The 8bit wav is really distinctive. Images always have arcs or continuous curved lines. Text is always boxy arrays. It becomes quite easy to identify data types just by eye. It's probably be fairly feasible to train a small visual model to do this automagically with a synthetic dataset of labeled binary data types and normalized digraph images.
[comment on this post] Append "/@say/your message here" to the URL in the location bar and hit enter.
memgaze-pdl.pl (118KB, requires libperl-gtk2, PDL, and 'aplay' binary for sound)
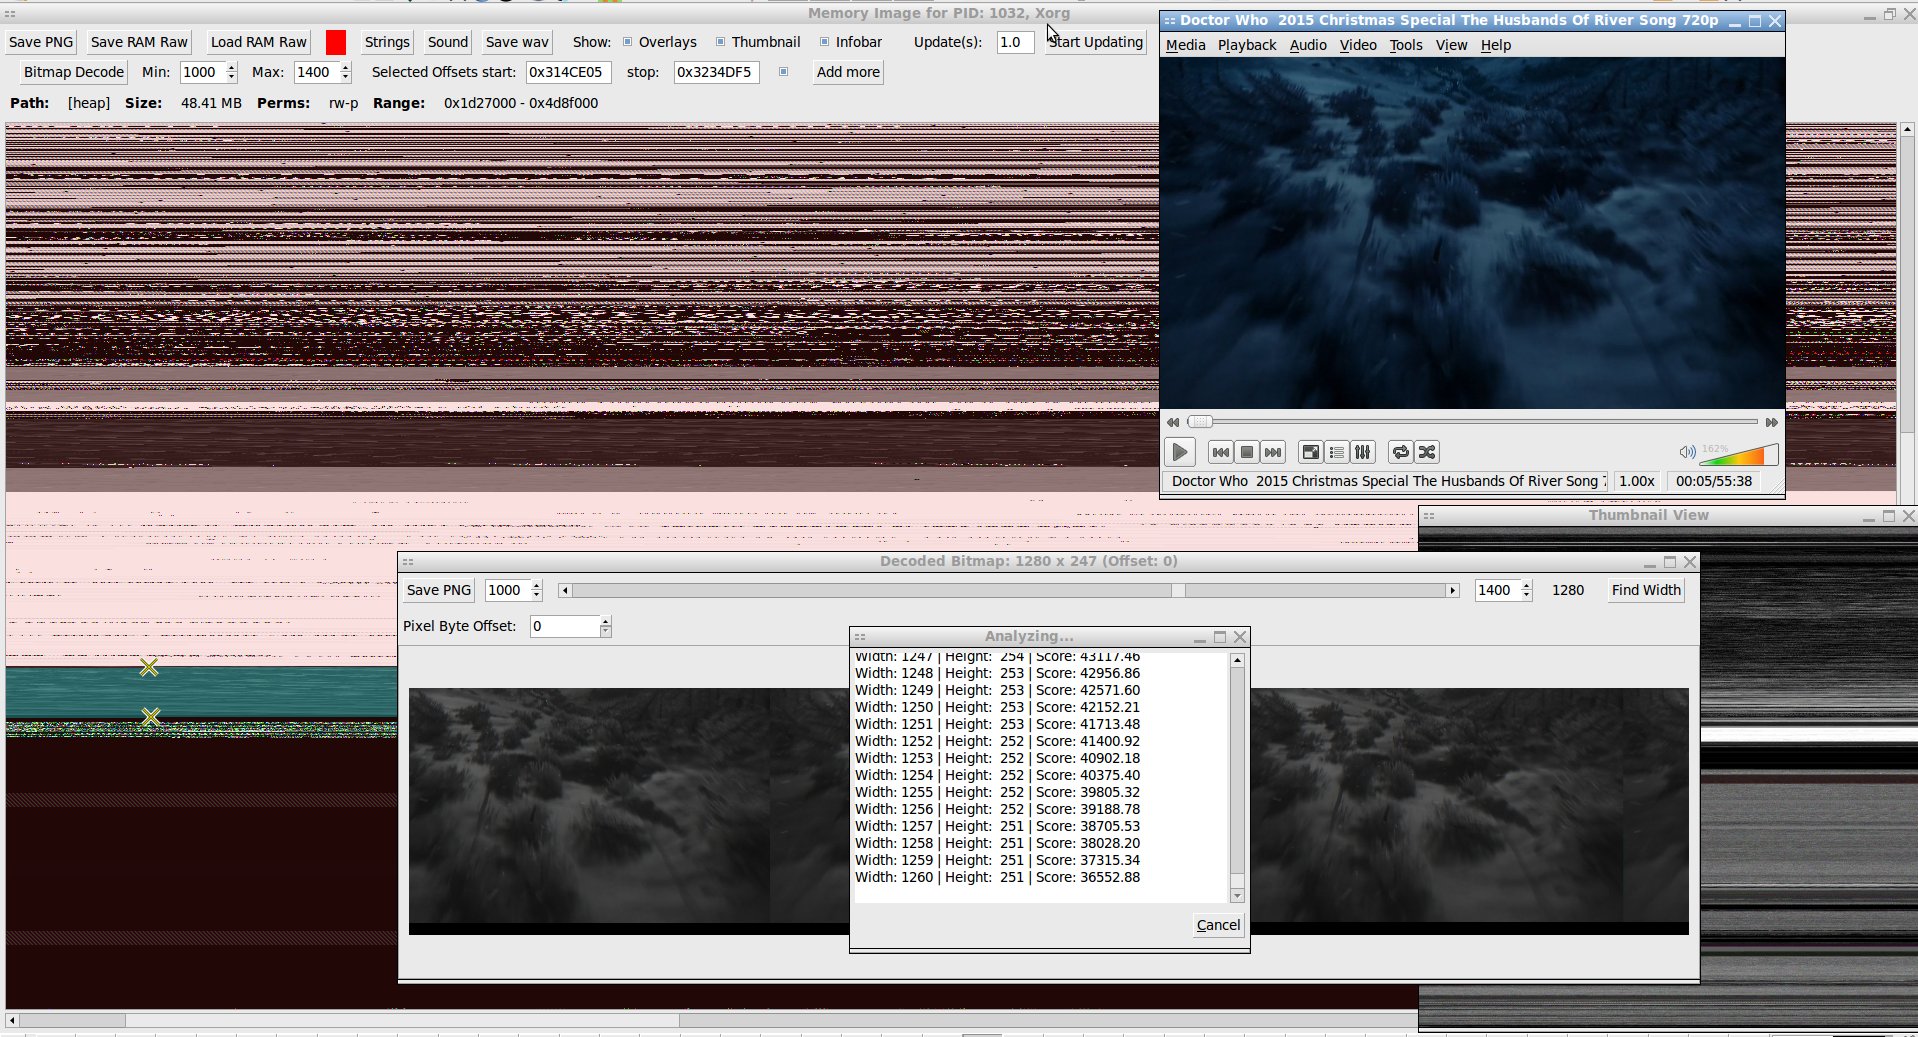
This is another release of memgaze but with a bunch of quality of life fixes and a few new features like the tools for better extracting specific images and algorithmically solving for their likely original image widths.
This algorithm is based it on the idea that while manually adjusting the horizontal image width with a slider I'd see how there'd be diagonal lines (aliasing?) formed whenever the horizontal width wasn't just right (or some harmonic multiple of right). If it was right then the pixel at X position 89 in one line would likely be the same or similar to pixel at X position 89 in the line below it. Vertical lines. Only when it was the right width would the slanted lines disappear. Telling this to gemini-2.5-pro resulted in the code to do it.
It steps through a large range of tested horizontal resolutions and for each it compares vertically adjacent pairs of lines in the image to see how different they are. Specifically it does line_n - line_n+1 = score and takes the absolute value of [score] for all line pairs in an image summed together as the real score for that test width. The lower the score, the more the two adjacent lines are very close to the same, the more likely it is that that's the right resolution without wrapping or aliasing. So it goes through and computes the net score for each resolution and then reports the one with the lowest as the likely horizontal resolution and sets the image object to display it.
This usually works. If there's no real order in the data it'll often have a bias for settling on lower horizontal resolutions rather than higher. But for actual image data it will at least settle on an alias of the image from which you can figure out (based on overlaping/mirror repetition) to go higher or lower manually to find the true width. And if the image representation in ram has blank lines between actual lines this only find harmonic multiples of the true resolution.
sub calculate_vertical_coherence_fast {
    my ($pixels, $width, $height, $step) = @_;

    my $rowstride = $width * 3;
    my $total_difference = 0;

    # Iterate with a step for both x and y to sample the image
    for (my $y = 0; $y < $height - $step; $y += $step) {
        for (my $x = 0; $x < $width; $x += $step) {
            my $offset1 = ($y * $rowstride) + ($x * 3);
            my ($r1, $g1, $b1) = unpack('CCC', substr($pixels, $offset1, 3));

            # Compare with the pixel $step rows below
            my $offset2 = (($y + $step) * $rowstride) + ($x * 3);
            my ($r2, $g2, $b2) = unpack('CCC', substr($pixels, $offset2, 3));

            $total_difference += abs($r1 - $r2) + abs($g1 - $g2) + abs($b1 - $b2);
        }
    }
    return $total_difference;
}
In native perl these many comparisons were kind of slow. So I asked gemini-2.5-pro for help (again) and it made a really clever PDL (perl data language, compiled c/fortran internals for fast operations) version that at least 10x as fast as the cost of slightly increased RAM usage for memgaze.pl. With PDL piddle objects nothing is ever really copied or moved. Instead PDL creates different "views" of the same object and this is much faster.
    for my $test_width ( $min_width_to_test .. $max_width_to_test ) {
        ...
        my $trimmed_size = $test_width * $test_height * 3;
        my $image_pdl = $pdl_data->slice("0:" . ($trimmed_size - 1));

        my $reshaped = $image_pdl->reshape(3 * $test_width, $test_height);
        my $top_rows = $reshaped->slice(":,0:-2");
        my $bottom_rows = $reshaped->slice(":,1:-1");
        my $score = sum(abs($top_rows - $bottom_rows));

        my $normalized_score = $score / $test_height;
        ...
        if ($lowest_score == -1 or $normalized_score < $lowest_score) {
            $lowest_score = $normalized_score;
            $best_width = $test_width;
        }
    }
$top_rows is one of those "views". It includes all columns (:) but only rows from the first (0) up to, but not including, the last (-2). For a 1920 px wide test that'd be rows 0 through 1919. $bottom_rows is a view that includes all columns (:) but only rows from the second (1) up to the very end (-1). So that'd be rows 1 to 1920. That's two arrays of the exact same dimensions perfectly aligned so that row n in $top_rows corresponds to the original row n, and row n in $bottom_rows corresponds to the original row n+1. So when $top_rows - $bottom_rows it subtracts the entire bottom_rows array from the top_rows array, element by element, all at once in highly optimized C code. The result is a new piddle of the same size containing all the differences for taking the absolute value and sum.
Another problem for me personally writing the thing was that as soon as I use PDL;'d it overloaded a lot of the CORE:: perl functions like index() and suddenly my 'Process' list search button stopped working and giving wild errors with line numbers that didn't match to the code it was talking about. And at the time I had no idea that use PDL; overloaded/replaced functions like this. I spent a half day trying to figure it out before eventually someone on IRC mentioned PDL did this and I realized that index() had been replaced with PDL::index(). Changing all my index and related to CORE::index fixed it but I'd never have figured this out on my own. It stumped gemini-2.5-pro too.
            while (defined $search_iter) {
                my $display_text = lc($model->get($search_iter, 0));
                # use CORE::index to avoid conflict with PDL::index
                if (CORE::index($display_text, $search_text) != -1) {
                    $selection->select_iter($search_iter);
                    my $path = $model->get_path($search_iter);
                    $proc_tree_view->scroll_to_cell($path, undef, FALSE, 0, 0);
                    return; # Found a match, we're done.
                }
                $search_iter = $model->iter_next($search_iter);
            }
p.s. the funnest feature in this new version is wildly moving the image width slider around and seeing the aliasing "animate".
[comment on this post] Append "/@say/your message here" to the URL in the location bar and hit enter.
One day I decided I wanted to be able to "see" what was going on inside the RAM in my linux desktop computer. And now through the magic of LLM AIs and some time, debugging, and tweaks, I can. I haven't ported it to gtk3 yet so it's gtk2 only for now.
memgaze.pl (94KB, requires libperl-gtk2 and 'aplay' binary for sound)
memgaze is a linux process virtual RAM exploration tool. It creates visualizations as images of the *virtual* RAM of any accessible process (run with sudo) and can save them as PNG. It also can play any RAM dump or subsection(s) of it as a sound file or save to wav. It has tool-tip overlays that show what type of RAM allocation it is and what, if any file it's associated with on disk (or heap or stack or anonymous) on both the hilbert map and image map.
To make the image memgaze walks through massive strings of ram dump bytes, taking them three at a time to form each pixel. Each byte has a value from 0 to 255. Coincidentally each color channel in a standard 24-bit RGB pixel is also represented by a value from 0 (no intensity) to 255 (full intensity). This allows for a 1-to-1 mapping.
The 1st byte becomes the Red component of the first pixel.
The 2nd byte becomes the Green component of the first pixel.
The 3rd byte becomes the Blue component of the first pixel.
The 4th byte becomes the Red component of the second pixel.
The 5th byte becomes the Green component of the second pixel.
And so on...
You might think this would lead to inconsistent coloring just because something shifts by one byte but it's not. The same libraries always look the same way when loaded in ram and visualized this way. Even between reboots and across different computers. And with time I'm starting to see how different types of RAM allocations have different types of textures. The data really does speak for itself.
For generating sound it's different.
But first a diversion: I've found some really interesting sounds in various programs. I really like libgtk-3.so it has some nice bass. Here's some musical tracks that I selected as truly "computer generated" music. Listen to this while you read how it works.
The stream of bytes from memory is a sequence of points that define a sound wave. Each byte's value is interpreted as the amplitude (loudness or position) of the sound wave at a single, tiny moment in time.
Unlike the image which groups bytes into threes, the sound translation treats every single byte individually. For sound the RAM dump is interpreted as unsigned 8 bit values and each byte is treated as an unsigned integer from 0 to 255. This number represents the position of the speaker cone at one instant. A value of 128 is considered the "center" or silent position. A value of 255 tells the speaker to push all the way out. A value of 0 tells the speaker to pull all the way in.
A sequence of bytes like 128, 150, 200, 255, 200, 150, 128, 100, 50, 0, 50, 100, 128... would create a simple smooth oscillation (a pure tone).
For example a snippet of memory containing the ASCII string "Hello..." followed by some binary data.
Hex Value 	Decimal Value 	Interpretation as Sound Amplitude
0x48 	72 	Speaker cone is pulled in from center.
0x65 	101 	Speaker cone is still pulled in, but closer to center.
0x6C 	108 	Getting even closer to center.
0x6C 	108 	No change from the last sample.
0x6F 	111 	Still pulled in.
0x00 	0 	Speaker cone pulls all the way in (max negative).
0xFF 	255 	Speaker cone pushes all the way out (max positive).
0x7F 	127 	Almost perfectly centered (nearly silent)
When played back at 8,000 bytes per second (8 KHz sample rate), this sequence creates a series of rapid clicks and pops. The relatively smooth values of the "Hello" string would sound like a low, static-like rumble. The sudden jump from 0x00 (0) to 0xFF (255) would produce a very sharp "click" or "pop" because it's telling the speaker to move from its most retracted position to its most extended position in just 1/8000th of a second.
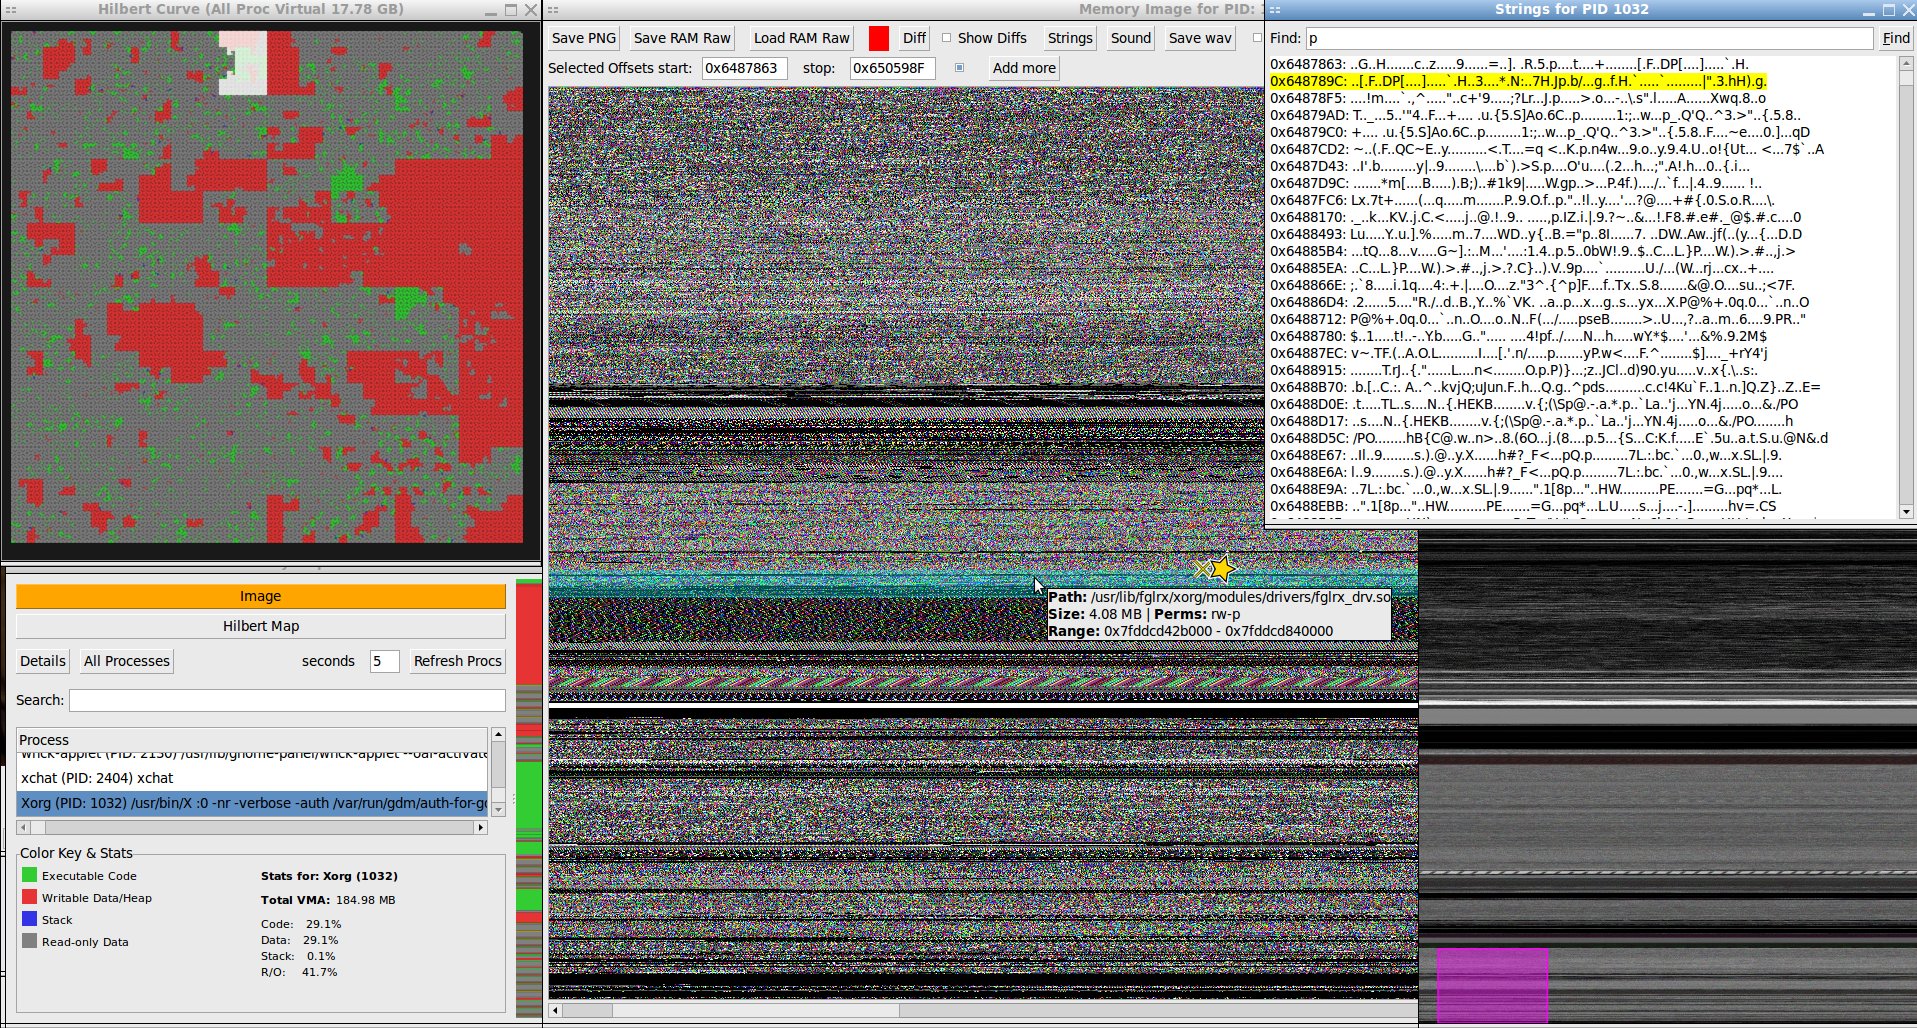
To get a birds eye view of the virtual ram system it maps all used virtual ram onto a space filling hilbert curve with selectable sub-section and tool-tips showing the proportional use of virtual RAM by every process. Right click any highlighted process on the map to 'Image' it's RAM in a new window. To be clear, this is virtual RAM mappings, and the numbers it gives are not useful when you're trying to figure out the physical amount of RAM any given process is using (though it is proportional).
On the image map there's a small "thumbnail" view for zipping around truly gigantic ram dump images for convenience on slower machines. The image of the RAM can animate it live at the user supplied rate (default every 1s) but this only really works with small amounts of RAM because refreshing big GB amounts takes time. When the RAM is 'Updating' the state it was when the 'Update' button was pressed is stored to compare against the final state when updating is done with the 'Diff' tool which turns green when there's an old version to diff against. The 'Strings' tool runs $ strings against the full RAM image or whatever set of offset selections are checkbox marked active and then marks them on the RAM image with a star and recenters the view on this location and displays all matches with their file offset in the text box. Deleting the search string and hitting enter on the empty box restores the raw strings output list.
[comment on this post] Append "/@say/your message here" to the URL in the location bar and hit enter.